independent urban research · Amsterdam
Measuring how cities actually work.
We collect, clean and publish data on walking, housing, heat and public space — and turn it into findings that councils, designers and residents can use.
city_indicators.csvupdated 2026-10
homes within 10 min of a park71%+6.2 pt
trips made on foot or bike58%+3.9 pt
hottest-street surface temp.47 °C+1.4 °C
median rent / income38%+2.1 pt
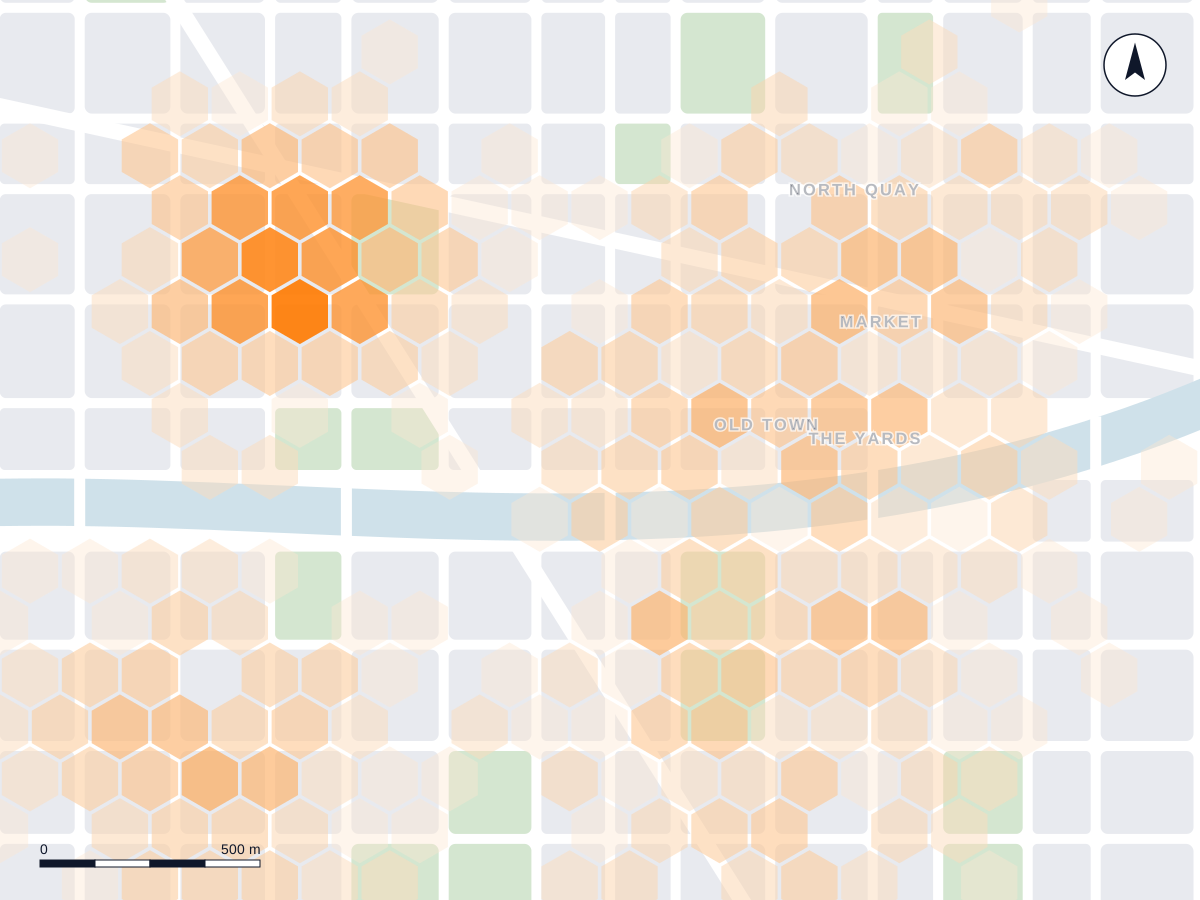
latest findings
What the data says
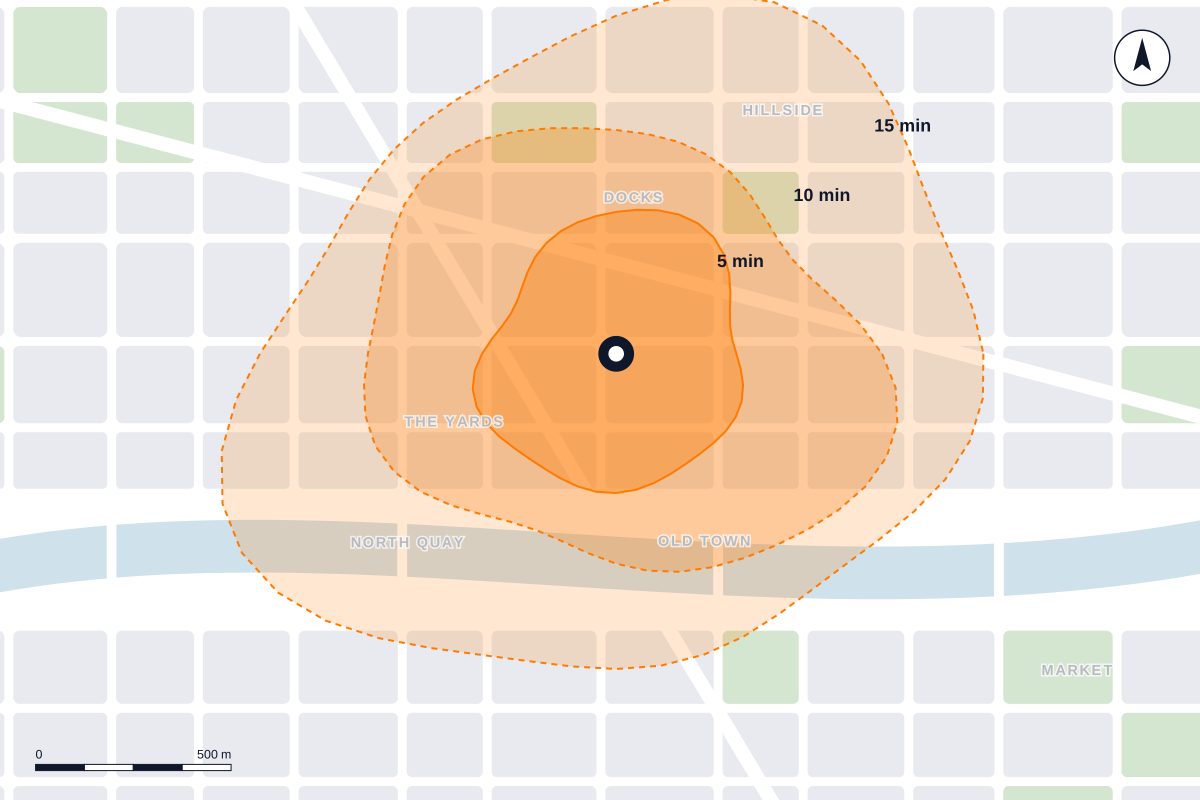
report1 in 4
The 15-minute gap
A quarter of homes are more than 15 minutes' walk from a GP, school and grocery store combined.
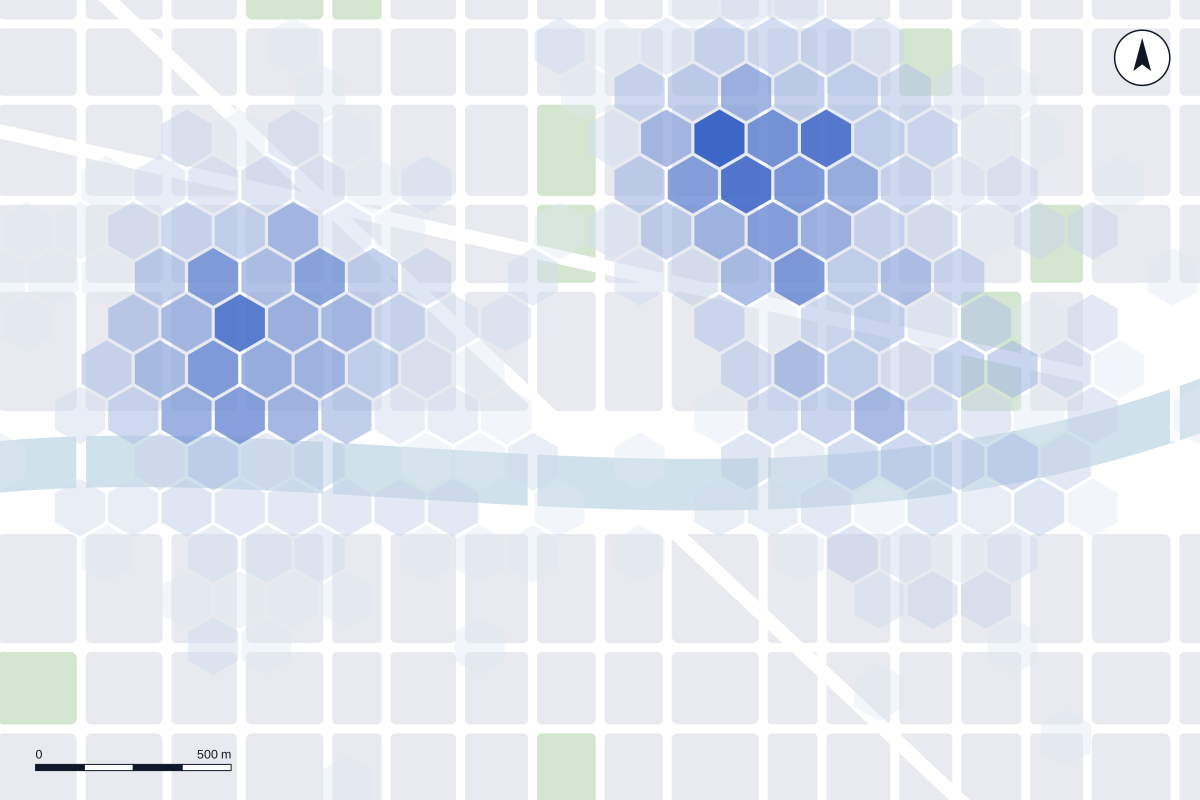
data story+9 °C
Streets without shade
Unshaded streets are up to nine degrees hotter at 4 pm than streets with mature trees.
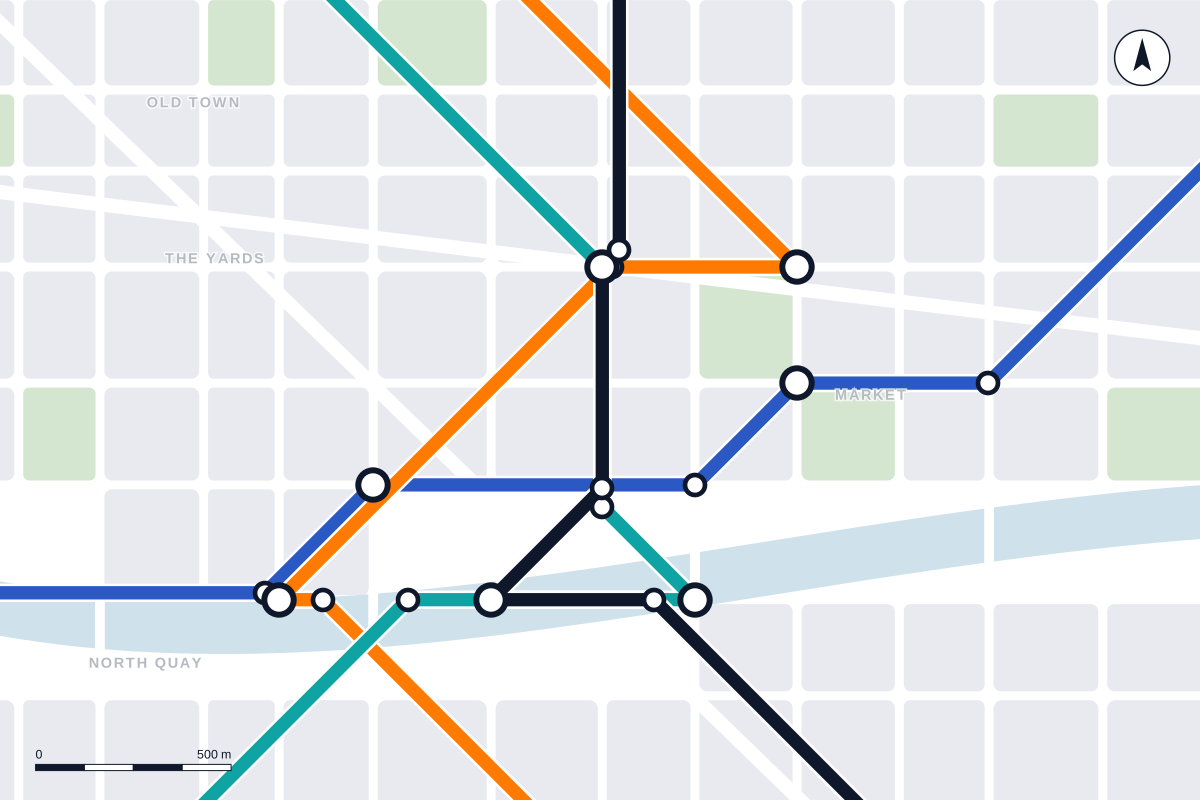
dataset2.1 M
Every stop, every minute
Open timetable data for every tram, bus and ferry stop, cleaned and joined to census blocks.
interactive
Ten years of walking to school
Share of children who walk or cycle to primary school, by district. Switch years to see the change after the school-street programme.
source: Parcel Lab school travel survey, n = 14,210 · CC BY 4.0